Fiber Update: Twenty-five years of changing fortunes in the carpet industry - Aug/Sep 2017
By Alasdair Carmichael
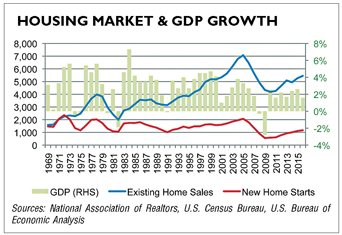
One of the main drivers of carpet use is the housing market, which is partly driven by GDP. The relationship between housing and GDP, going back almost 50 years to 1969, is displayed in the Housing Market & GDP Growth chart. In 1991, GDP growth was negative, and both housing starts and existing housing sales dropped by 44% and 12%, respectively, from five years earlier. However, the economy bounced back in 1992 and recorded 3.6% GDP growth, which led to a very strong housing market through to 2005 when existing home sales hit an all-time high and new home starts hit the second highest level on record. As a result of this very strong housing activity, carpet and rug face fiber consumption reached a record 3.57 billion pounds in 2005.
Comparing the continued growth in both housing indicators in 2001 and 2002 when GDP only grew 1% and 1.8%, respectively, was a good signal that the housing market was moving ahead of fundamentals, and a correction was to be expected. The severity of the correction was not expected: existing home sales fell 41% and new home starts fell 73% within five years.
Clearly, demographics are also a major influence, but, as they are very much straight-line growth, they do not correlate with short-term fluctuations. The U.S. population in 1969 was 203 million, and in 2017 it has grown to 325 million-a 60% growth rate. New home starts have lagged dramatically behind population growth, but existing home sales are ahead of population growth.
CARPET FIBER TRENDS: 1992 TO 2016
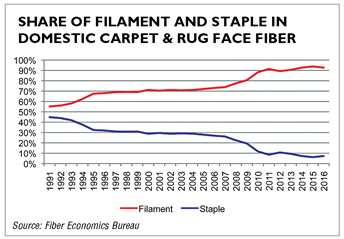
In 1992, the share of face fibers into the U.S. carpet industry was 56% filament and 44% staple; in 2016, this had shifted to 93% filament and 7% staple. Why the change? There are a number of reasons, but it has mostly been driven by price and technology. In 1992, there were still problems in filament uniformity, and one end of the filament that did not dye uniformly could create a large amount of off-quality carpet.
The benefit of staple was that the production process results in a large number of extruded ends being blended together, so any inherent lack of uniformity was masked in the final carpet. As improved process technology allowed for higher levels of filament uniformity, the industry was able to reduce off-quality production and, as filament has a lower manufacturing cost than staple, the move to filament accelerated.
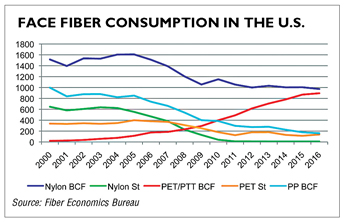
The other significant change that happened in face fiber is the incredible growth of polyester BCF, including PTT. In 1992, there was no polyester BCF listed in industry figures; the only polyester was staple. In fact, it was not until 2000 that polyester BCF showed in figures, with 22 million pounds; undoubtedly there was some trial production in earlier years but not sufficient volume to register. By 2016, consumption had increased to 895 million pounds, second only to nylon BCF at 973 million pounds. Based on the first five months of 2017, it is likely that for the first time polyester BCF domestic production will exceed nylon BCF production for the full year. There are relatively small volumes of nylon BCF imports, which will still leave nylon narrowly ahead in total consumption.
The styling change away from berbers, where polypropylene BCF was the preferred fiber, to a tufted construction gave polyester BCF the opportunity to take significant share of the face fiber market in the latter stages of the first decade of the 21st century.
A shift in housing demographics also occurred as the U.S. experienced the fallout from the housing and sub-prime mortgage recession. With many families no longer able to qualify for mortgages, the construction industry changed to building fewer single-family homes and more apartments and condominiums to meet the increased need for rental properties. Typically, in rental properties, we see landlords looking for a lower cost carpet and lower face weight. Polyester BCF carpet was a good option for this market. The relatively limited range of colors required in this sector also played very well into the solution-dyed polyester market.
STRUCTURE OF THE FIBER INDUSTRY
The major long-term shift has been the concentration of integrated fiber production into the carpet mills. In 1992, this had already happened in the polypropylene market, but nylon was still dominated by petrochemical company producers like DuPont, Monsanto, Honeywell and BASF, all of whom had left the business ten years later. The only area where independent fiber producers dominate in 2017 is in nylon 6,6 BCF production, where Invista has one remaining U.S. plant, compared to three in 2000, and Ascend also has one. Both companies have control of key raw material ingredients.
As polyester BCF became the dominant growth fiber in the last 12 years-from 75 million pounds in 2004 to 890 million pounds in 2016-production has been concentrated on the integrated carpet mills. Mohawk, Shaw and Engineered Floors are estimated to have 80% of the total polyester and PTT BCF capacity. Much of the production by Mohawk and Shaw is based on using recycled PET as the raw material source. This allows the two companies to market specific carpet brands as having “green” credentials by being produced partly, or fully, from recycled materials.
Currently, the U.S. market is seeing increased tightness in the availability of bottles for recycling and the price for baled bottles has increased by up to $0.08/pound to $0.10/pound since January 2017. At the same time virgin polyester chip has fallen approximately $0.05/pound, making the comparative economics much more challenging for the recycling process. U.S. bottle collection levels are very low compared to world averages and, with demand for recycled content continuing to increase in a number of U.S. fiber and non-fiber end uses, we anticipate that price pressure will continue to keep bottle prices high.
Copyright 2017 Floor Focus
Related Topics:Shaw Industries Group, Inc., Engineered Floors, LLC, Mohawk Industries